Most SEO reports still look generic — a bunch of rankings, some traffic numbers, and a vague mention of “improvements.” But here’s the truth: if your SEO KPI reporting doesn’t connect to revenue, visibility in AI answers, and real user behavior, you’re flying blind.
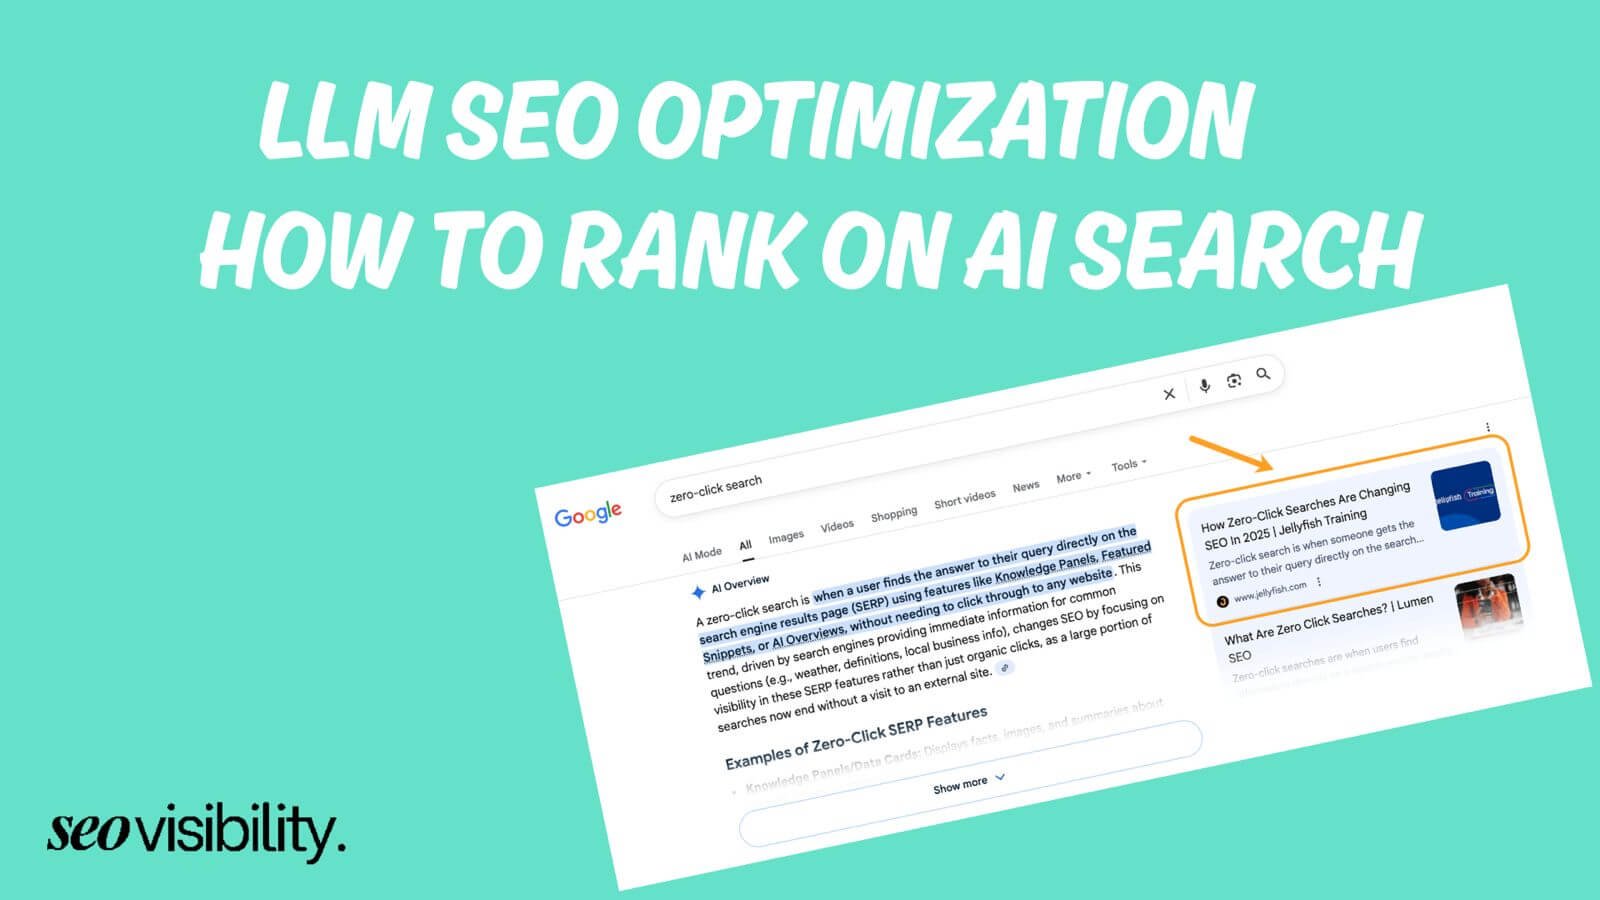
In 2026, SEO has changed dramatically. AI Overviews are eating clicks. Zero-click searches now account for a significant chunk of all queries. Google’s ranking signals have grown more sophisticated, and large language models like ChatGPT and Perplexity are becoming discovery engines in their own right.
This guide breaks down the 9 essential categories — what they are, why they matter, and how to track them — so you can build smarter reporting and prove the real value of SEO.
What Is a KPI in SEO?
A KPI in SEO (Key Performance Indicator) is a measurable value that tells you how well your organic search strategy is performing against a specific goal. Not every metric is a KPI. Metrics are just numbers. A KPI is a metric tied to a business outcome — like revenue, leads, or brand growth.
Good SEO KPI reporting excludes vanity metrics (like total impressions) from metrics that signal real progress toward traffic, conversions, and authority. The best SEO experts use a layered approach: tracking visibility, behavior, technical health, and conversions together.
9 Essential SEO KPIs to Track SEO Performance
If you manage SEO in 2026, tracking the right SEO KPI is more important than ever. Search is fragmented across Google, AI Overviews, LLMs, and social, so surface‑level metrics like “traffic is up” are no longer enough.
You need SEO metrics that show whether your work is driving visibility, qualified clicks, engagement, and real business outcomes like leads and revenue.
Let’s go through the 9 essential KPIs you should track, how they fit together, and how to use them to build smarter SEO KPI reporting that your CMO and stakeholders actually care about.
| Key Performance Indicators (KPIs) | SEO Metrics |
|---|---|
| Visibility | Share of Voice, keyword rankings, AI Overviews, featured snippets |
| Click & Traffic | Organic clicks, CTR, branded vs non‑branded traffic, zero‑click impressions |
| Engagement Signals | Engagement rate (GA4), scroll depth, average engagement time |
| Topical Authority | Content clusters, internal linking, and topic depth |
| Technical Performance | Core Web Vitals (LCP, INP, CLS), crawl errors, and mobile usability |
| Brand Mentions | Branded search volume, direct traffic, web mentions |
| AI / LLM Visibility | ChatGPT / Perplexity / Gemini mentions, citation frequency |
| Content Performance | Informational vs commercial intent, drop‑off points |
| Conversion KPIs | Leads, organic conversion rate, assisted conversions, revenue per page |
1. Visibility KPIs
Visibility is the foundation of SEO. Before anyone clicks, they have to see you.
Share of Voice (SOV)
Share of Voice measures how often your website appears in search results compared to your competitors for a defined set of keywords. It’s one of the most strategic SEO metrics because it shows your relative position in the market — not just how you rank in isolation.
To calculate SOV, divide the number of clicks your site receives for a keyword set by the total available clicks across all sites ranking for those keywords. Tools like Semrush, Ahrefs, and SEOmonitor can automate this. A rising SOV means you’re taking market share. A shrinking one is a red flag, even if your traffic looks stable.
Keyword Rankings (Top 3 / Top 10)
Rankings still matter — but what matters more is which positions you’re in. Ranking in the top 3 results drives disproportionately more clicks than positions 4–10, and anything beyond page one gets minimal traffic in most niches.
Track keyword rankings segmented by top 3, top 10, and positions 11–20 so you can measure movement that’s actually meaningful. Use Google Search Console (GSC) alongside a rank tracker like Ahrefs or Semrush for the most accurate view.
Presence in AI Overviews and Featured Snippets
In 2026, SERP features are more important than ever as a visibility KPI for SEO. Google’s AI Overviews appear at the top of results for a growing share of queries, and appearing inside one can generate significant brand exposure — even if no click follows.
Track your featured snippet wins, People Also Ask appearances, local packs, and AI Overview inclusions separately. Tools like Semrush and Bright Edge can show which SERP features you currently own and where competitors are displacing you.
2. Click & Traffic KPIs
Visibility is great. Traffic is better. These metrics measure whether your SERP presence is actually driving people to your site.
Organic Clicks (Google Search Console)
Organic clicks from GSC are the purest measure of how much search traffic your site is generating. Unlike third-party estimates, GSC data comes directly from Google — making it the most reliable source for this KPI for SEO.
Monitor total clicks month-over-month and year-over-year. Segment by branded vs. non-branded queries, by page type, and by device. Sudden drops often signal a ranking loss, a title tag issue, or a new SERP feature stealing clicks.
Click-Through Rate (CTR) by Query and Page
CTR tells you how compelling your titles and meta descriptions are to real searchers. A page ranking in position 3 with a 2% CTR is underperforming compared to industry benchmarks — and fixing the title tag alone can recover significant traffic without changing your ranking at all.
In GSC, sort pages by impressions and filter for those with low CTR. These are your biggest quick-win opportunities. A/B testing title tags systematically is one of the highest-ROI activities in SEO right now.
Branded Vs. Non-Branded Traffic
This split is one of the most underused SEO metrics in reporting. Branded traffic (people searching your company name) reflects awareness and loyalty. Non-branded traffic reflects discoverability — how well you’re reaching people who don’t already know you.
A healthy SEO strategy grows both. If your organic traffic is 80% branded, you have a discovery problem. If it’s almost entirely non-branded and conversions are low, you may be attracting the wrong audience. Filter in GSC by excluding brand-name queries to see your true non-branded performance.
Zero-Click Impressions
Zero-Click Impressions
Zero-click impressions measure how often your content appears in SERP features where users get their answer without clicking — AI Overviews, featured snippets, knowledge panels. These aren’t wasted impressions. They build brand awareness and trust over time.
Track this in GSC by comparing impressions to clicks. A high impression-to-click gap isn’t always a problem — it may mean your content is being used in AI answers, which is a form of authority building.
3. Engagement Signal KPIs
Google’s ranking systems increasingly rely on user behavior signals. These metrics show whether visitors actually find your content useful.
Google’s ranking systems increasingly rely on user behavior signals. These metrics show whether visitors actually find your content useful.
Engagement Rate (GA4)
In GA4, Engagement Rate replaced Bounce Rate and is now one of the core SEO metrics for content quality. An engaged session lasts longer than 10 seconds, has a conversion event, or includes at least two page views.
A good engagement rate for most content-driven sites falls between 55–70%. Below 50% typically signals a content-intent mismatch — you’re ranking for a query but not delivering what the searcher actually wanted. Use GA4’s engagement rate by landing page to identify which pages need content improvements.
Average Engagement Time
Average engagement time shows how long users are actively interacting with your page — not just how long the browser tab was open. It’s a more honest signal than the old “time on page” metric.
For long-form content like guides or tutorials, you’d expect engagement times of 3–5 minutes or more. For product pages, 30–90 seconds may be healthy. The key is benchmarking against your own pages and improving outliers.
Scroll Depth
Scroll depth tells you how far down the page users are actually reading. If 70% of users drop off before reaching the halfway point of a blog post, the introduction isn’t holding attention, no matter how well the post ranks.
Use GA4 custom events or tools like Microsoft Clarity (free) or Hotjar to track scroll depth. Use the data to restructure content, move key information higher, and reduce padding in the early sections of your pages.
4. Topical Authority KPIs
Google doesn’t just rank pages. It evaluates the depth and breadth of your site’s expertise on a topic. Topical authority is now a core ranking driver — and it needs its own set of KPIs.
Content Clusters Built
A content cluster is a group of related pages — a pillar page covering a broad topic supported by several in-depth articles on subtopics. Tracking how many clusters you’ve built and how complete they are is a meaningful SEO marketing KPI because it shows your coverage of a topic over time.
Start by auditing your existing content. Map pages to topics. Identify gaps where competitors have coverage you don’t. A cluster isn’t complete until you’ve covered the core query and the most common related questions searchers have about it.
Internal Linking Strength
Internal links distribute authority across your site and help Google understand the relationship between your pages. Weak internal linking is one of the most common reasons strong content fails to rank — Google simply doesn’t discover or prioritize it.
Track internal link counts per page using tools like Ahrefs or Screaming Frog. Focus especially on your pillar pages — they should be the most internally linked pages on your site. Orphan pages (pages with no internal links pointing to them) are a direct ranking liability.
Keyword and Topic Depth
This KPI measures how comprehensively your site covers a topic — not just whether you have a page on it, but whether you’ve addressed all meaningful angles of that subject. Tools like Clearscope, Surfer SEO, and MarketMuse score your content against top-ranking competitors to show topic gaps.
Deeper coverage leads to more keyword rankings, more featured snippets, and stronger signals to both Google and AI models that your site is a primary source on a topic.
5. Technical Performance KPIs
Technical SEO is the backbone of everything else. Even the best content won’t rank consistently if your site has crawling, speed, or usability problems.
Core Web Vitals (LCP, INP, CLS)
Core Web Vitals are Google’s official page experience metrics and remain a confirmed ranking signal in 2026. The three metrics are:
- LCP (Largest Contentful Paint): How fast your main content loads. Target under 2.5 seconds.
- INP (Interaction to Next Paint): How responsive your page is to user inputs. Target under 200 milliseconds.
- CLS (Cumulative Layout Shift): How stable your layout is as it loads. Target under 0.1.
Check your Core Web Vitals in Google Search Console under the “Experience” report. Sites that consistently pass all three metrics tend to have a measurable ranking advantage over sites that fail them.
Crawl Errors and Indexation
If Google can’t crawl or index your pages, nothing else matters. Track crawl errors, coverage issues, and indexation status regularly in GSC. Common issues include noindex tags applied to important pages, redirect chains, and pages blocked in robots.txt.
Monitor your index coverage report weekly. Any sudden spike in “Excluded” or “Error” pages needs immediate investigation — it can mean a misconfigured deployment or a site migration issue silently killing your rankings.
Mobile Usability
Google indexes the mobile version of your site first. If your mobile experience is broken, your rankings suffer across all devices. Track mobile usability issues in GSC and test individual pages using Google’s Mobile-Friendly Test.
Pay particular attention to tap target sizes, font sizes, and content overflow issues — these are the most common mobile usability failures that affect real user experience and SEO performance simultaneously.
6. Brand Mention KPIs
Brand mentions are both a leading indicator of SEO authority and a direct signal that your content marketing is working beyond the search results page.
Branded Search Volume
Branded search volume — how many people search for your company name or variations of it — is a proxy for brand awareness and demand. Growth in branded search volume over time means your SEO and content marketing are building real brand equity, not just traffic.
Track this in GSC by filtering for your brand name. Rising branded search often precedes broader organic growth because it signals to Google that people are actively looking for you — a strong quality signal.
Direct Traffic and Web Mentions
Direct traffic (users typing your URL directly or accessing via bookmarks) reflects strong brand recall. Combined with branded search, it paints a picture of how well-known your brand is becoming. Web mentions — appearances in articles, press releases, social posts, and forums — contribute to off-page authority and can drive links over time.
Use tools like Google Alerts, Mention, or Ahrefs Content Explorer to track brand mentions across the web. Unlinked mentions are opportunities to request backlinks from sites already citing your brand.
7. AI / LLM Visibility KPIs
This is the newest category of SEO metrics — and one of the most important to start tracking right now.
Mentions in ChatGPT, Perplexity, and Gemini
Large language models are becoming primary discovery tools for millions of users. When someone asks ChatGPT or Perplexity a question in your niche, is your brand being mentioned in the answer? This is a form of visibility that doesn’t show up in Google Analytics — but it has real business impact.
Tools like Profound, Otterly.ai, and AI Rank Tracker are emerging specifically to track LLM mentions and citation frequency. Manually testing key queries in major AI tools is also a practical starting point for many teams.
Citation Frequency in AI Answers
Citation frequency measures how often AI models reference your content, link to your pages, or name your brand when generating answers. Higher citation rates correlate strongly with having comprehensive, structured, and authoritative content that LLMs can easily extract and use.
To improve LLM visibility, structure your content with clear headers, direct answers to common questions, and accurate data. Entities and structured markup (Schema.org) help AI models understand and trust your content as a source worth citing.
8. Content Performance KPIs
Not all content serves the same purpose — and measuring performance requires matching the KPI to the intent.
Informational vs. Commercial Content Performance
Informational content (blog posts, guides, FAQs) should be measured differently from commercial content (product pages, service pages, landing pages). For informational content, strong KPIs include organic traffic, engagement rate, and scroll depth. For commercial content, the primary KPIs are conversion rate, leads, and assisted revenue.
Mixing these up leads to misleading reports. A blog post with high traffic but zero conversions isn’t underperforming — it’s doing its job. A product page with high traffic and zero conversions absolutely is.
Conversion Per Intent Type and Drop-Off Points
Mapping conversions to the intent behind the query helps you identify exactly where your funnel is leaking. Use GA4 funnel exploration reports to see where users drop off — whether that’s on the landing page, a pricing page, or a checkout flow.
Drop-off analysis at the page level reveals whether the problem is a content issue (wrong information), a UX issue (bad layout), or a trust issue (missing social proof or security signals). Fixing these drop-off points has a compounding effect on conversion rate across all organic traffic.
9. Conversion KPIs
This is where SEO connects directly to revenue — and where the strongest business case for your SEO investment gets made.
| Conversion KPI | What It Measures | Recommended Tool |
|---|---|---|
| Leads / Signups / Sales from Organic | Total conversions attributed to organic search | GA4 + CRM |
| Organic Conversion Rate | % of organic visitors who complete a goal action | GA4 |
| Assisted Conversions | Organic’s role in multi-touch conversion paths | GA4 Attribution |
| Revenue Per Page / Keyword | Revenue generated by specific pages or queries | GA4 + GSC + CRM |
Leads, Signups, and Sales from Organic
This is the most direct SEO KPI for any business — how many actual leads, sign-ups, or sales came from organic search. Track this by setting up conversion goals in GA4 and integrating with your CRM to close the loop between organic visits and pipeline revenue.
Organic Conversion Rate
Organic conversion rate tells you what percentage of your organic visitors are taking the action you want. Average organic conversion rates vary significantly by industry, but consistent improvement over time — not hitting an arbitrary benchmark — is the goal.
Improving organic conversion rate doesn’t always require more traffic. It often means better landing page alignment with search intent, stronger calls to action, or faster page load times.
Assisted Conversions and Revenue Per Page
Most buyers don’t convert on their first visit. Assisted conversions show you how often organic search played a role in a conversion path, even when it wasn’t the last touchpoint. This is critical for demonstrating the full value of SEO to stakeholders who only look at last-click attribution.
Revenue per page and revenue per keyword are advanced metrics that require CRM integration. But for SaaS companies, e-commerce stores, and lead generation businesses, they’re the clearest proof that SEO is directly contributing to the bottom line.
Popular SEO Tools to Track SEO KPIs
| KPI Category | Primary Tools | Reporting Frequency |
|---|---|---|
| Visibility (SOV, Rankings) | Ahrefs, Semrush, GSC | Weekly |
| Click & Traffic | Google Search Console | Weekly |
| Engagement Signals | GA4, Hotjar, Clarity | Monthly |
| Topical Authority | Ahrefs, Screaming Frog, Surfer | Monthly |
| Technical Performance | GSC, PageSpeed Insights | Weekly |
| Brand Mentions | Google Alerts, Ahrefs, and Mention | Monthly |
| AI / LLM Visibility | Otterly.ai, Profound, Manual | Monthly |
| Content Performance | GA4, GSC | Monthly |
| Conversion KPIs | GA4, CRM | Weekly |
Start Tracking the Right Metrics and Growing Faster
Chasing every SEO metric is a distraction. The SEO managers, business owners, and marketers who win in 2026 are the ones who track the right KPIs — the ones that connect content and rankings to real business outcomes like leads, revenue, and brand authority.
The 9 KPI categories above cover every layer of SEO performance: from how visible you are in Google and AI answers, to how well your content converts visitors into customers. Start by picking two or three metrics from each category, establishing baselines, and setting clear targets for improvement.
If you want expert help building an SEO KPI framework that actually proves results, at SEO Visibility, Khalid Hussain has helped 999+ businesses, agencies, and eCommerce stores do exactly that with 15+ years of hands-on experience.
Whether you’re an in-house team, a startup, or an agency looking to sharpen your reporting, it’s worth scheduling a free consultation.


![How Much Does an SEO Expert Cost in 2026 [SEO Pricing]](https://seovisibility.co/wp-content/uploads/2026/01/how-much-does-an-seo-expert-cost.png)


![SEO Copywriting Checklist [Easy to Follow Guidelines]](https://seovisibility.co/wp-content/uploads/2026/01/seo-copywriting-checklist.png)